
Happy (belated) Tax Freedom Day

For many Americans, Tax Freedom Day has come and gone. Not to be confused with the April 15th IRS filing deadline for your federal income taxes, Tax Freedom Day is the day when the average American has earned enough to cover their federal, state, and local tax obligations for the year, and illustrates the financial burden of taxes on individuals. In other words, it's the days when you stop working for the government—and start working for yourself. For 2026, the Tax Freedom Day is estimated to be April 16th. Americans pay approximately 30% of their total income in taxes—about 114 days of work (1).
Tax Freedom Day answers the basic question, "What price am I paying for government?" It is not a difficult question to answer, but it varies from one person to another, their income tax level, and from state to state. Let me explain how your Tax Freedom Day is calculated.
Add up all the taxes you anticipate paying in a given year, including:
Federal income tax
State and local income taxes
Payroll taxes (Social Security and Medicare)
Property taxes
Sales and excise taxes
2. Determine your total annual income, including:
Wages
Salaries
Investment income
Other taxable earnings.
Compute the Tax Burden Ratio by dividing the total taxes paid by total gross annual income to get the fraction of income paid in taxes:
Tax Burden Ratio = Total Taxes Paid / Total Income
Translate to Days Worked by multiplying the tax burden ratio by 365 days to estimate the number of days the individual works to pay taxes:
Individual Tax Freedom Day=January 1 + (Tax Burden Ratio x 365 days)
For me, my Tax Freedom Day begins on May 5, 2026—125 days after January 1, 2026. The money earned in these first 125 days is not for me or my future, but for government bureaucrats and spending programs at the federal, state, and local levels. Anything earned after this date goes into my treasury, not the government's treasury.
To gain some perspective on how different it is per state, I have created an AI-generated Estimated 2026 State-by-State Tax Freedom Day map based on relative tax burdens and historical rank data from the Tax Foundation from 2015 to 2025.

As you can see from the AI-generated map above, South Dakota, on average, has one of the earliest Tax Freedom Days (March 27, 2026) in the United States, with New York having the worst (May 1, 2026). States with earlier Tax Free Days have led to interstate migration occurring, including to South Dakota, to more tax-friendly states led by Texas (+56,473), Florida (+55,349), North Carolina (+39,118), South Carolina (+29,214), Tennessee (+24,104), Arizona (+17,316), Georgia (+14,671), and Colorado (+11,341). At the other end of the spectrum, California (-100,397), New York (-71,987), Illinois (-28,609), New Jersey (-19,370), Massachusetts (-15,378), Maryland (-13,628), and Pennsylvania (-12,095) lost the largest numbers of income tax filers (2).
To further understand the impact taxes have on your total income based on where you live, let's evaluate what an individual making $65,000 a year would have to pay in taxes across all fifty states. Based on the 2025 State Tax Ranking table, South Dakota is essentially tied for first place amongst eight other states. See table below:
2025 State Tax Ranking for All 50 States + DC based on $65,000 annual income (Filing Status: Single)
Rank # | State | State Tax | Eff. Rate | Total Tax | Take Home | Annual Savings |
1 | Alaska | $0 | 0.00% | $10,722 | $54,279 | $0 |
2 | Florida | $0 | 0.00% | $10,722 | $54,279 | $0 |
3 | Nevada | $0 | 0.00% | $10,722 | $54,279 | $0 |
4 | New Hampshire | $0 | 0.00% | $10,722 | $54,279 | $0 |
5 | South Dakota | $0 | 0.00% | $10,722 | $54,279 | — |
6 | Tennessee | $0 | 0.00% | $10,722 | $54,279 | $0 |
7 | Texas | $0 | 0.00% | $10,722 | $54,279 | $0 |
8 | Washington | $0 | 0.00% | $10,722 | $54,279 | $0 |
9 | Wyoming | $0 | 0.00% | $10,722 | $54,279 | $0 |
10 | North Dakota | $88 | 0.14% | $10,810 | $54,190 | -$88 |
11 | Ohio | $638 | 0.98% | $11,360 | $53,641 | -$638 |
12 | New Jersey | $1,229 | 1.89% | $11,950 | $53,050 | -$1,229 |
13 | Arizona | $1,231 | 1.89% | $11,953 | $53,047 | -$1,231 |
14 | Indiana | $1,502 | 2.31% | $12,224 | $52,776 | -$1,502 |
15 | Pennsylvania | $1,512 | 2.33% | $12,233 | $52,767 | -$1,512 |
16 | Louisiana | $1,518 | 2.33% | $12,239 | $52,761 | -$1,518 |
17 | California | $1,533 | 2.36% | $12,254 | $52,746 | -$1,533 |
18 | West Virginia | $1,676 | 2.58% | $12,398 | $52,602 | -$1,676 |
19 | Vermont | $1,775 | 2.73% | $12,497 | $52,504 | -$1,775 |
20 | Arkansas | $1,843 | 2.84% | $12,565 | $52,435 | -$1,843 |
21 | Mississippi | $1,845 | 2.84% | $12,566 | $52,434 | -$1,845 |
22 | Rhode Island | $1,847 | 2.84% | $12,568 | $52,432 | -$1,847 |
23 | Connecticut | $1,966 | 3.02% | $12,688 | $52,312 | -$1,966 |
24 | Kentucky | $1,970 | 3.03% | $12,692 | $52,309 | -$1,970 |
25 | Michigan | $2,093 | 3.22% | $12,815 | $52,185 | -$2,093 |
26 | New Mexico | $2,134 | 3.28% | $12,855 | $52,145 | -$2,134 |
27 | Oklahoma | $2,151 | 3.31% | $12,872 | $52,128 | -$2,151 |
28 | Colorado | $2,167 | 3.33% | $12,889 | $52,112 | -$2,167 |
29 | Nebraska | $2,208 | 3.40% | $12,930 | $52,070 | -$2,208 |
30 | North Carolina | $2,216 | 3.41% | $12,938 | $52,062 | -$2,216 |
31 | Wisconsin | $2,224 | 3.42% | $12,945 | $52,055 | -$2,224 |
32 | Missouri | $2,252 | 3.46% | $12,973 | $52,027 | -$2,252 |
33 | Maryland | $2,287 | 3.52% | $13,008 | $51,992 | -$2,287 |
34 | Utah | $2,290 | 3.52% | $13,012 | $51,988 | -$2,290 |
35 | Delaware | $2,347 | 3.61% | $13,068 | $51,932 | -$2,347 |
36 | Kansas | $2,350 | 3.62% | $13,071 | $51,929 | -$2,350 |
37 | Alabama | $2,423 | 3.73% | $13,144 | $51,856 | -$2,423 |
38 | Illinois | $2,438 | 3.75% | $13,159 | $51,841 | -$2,438 |
39 | South Carolina | $2,459 | 3.78% | $13,180 | $51,820 | -$2,459 |
40 | Massachusetts | $2,463 | 3.79% | $13,184 | $51,816 | -$2,463 |
41 | Georgia | $2,507 | 3.86% | $13,229 | $51,771 | -$2,507 |
42 | Iowa | $2,508 | 3.86% | $13,229 | $51,771 | -$2,508 |
43 | Virginia | $2,574 | 3.96% | $13,296 | $51,704 | -$2,574 |
44 | Montana | $2,660 | 4.09% | $13,381 | $51,619 | -$2,660 |
45 | New York | $2,667 | 4.10% | $13,389 | $51,611 | -$2,667 |
46 | District of Columbia | $2,801 | 4.31% | $13,523 | $51,477 | -$2,801 |
47 | Idaho | $2,857 | 4.39% | $13,578 | $51,422 | -$2,857 |
48 | Minnesota | $2,913 | 4.48% | $13,634 | $51,366 | -$2,913 |
49 | Maine | $3,092 | 4.76% | $13,813 | $51,187 | -$3,092 |
50 | Hawaii | $3,317 | 5.10% | $14,038 | $50,962 | -$3,317 |
51 | Oregon | $4,024 | 6.19% | $14,746 | $50,254 | -$4,024 |
NOTES:

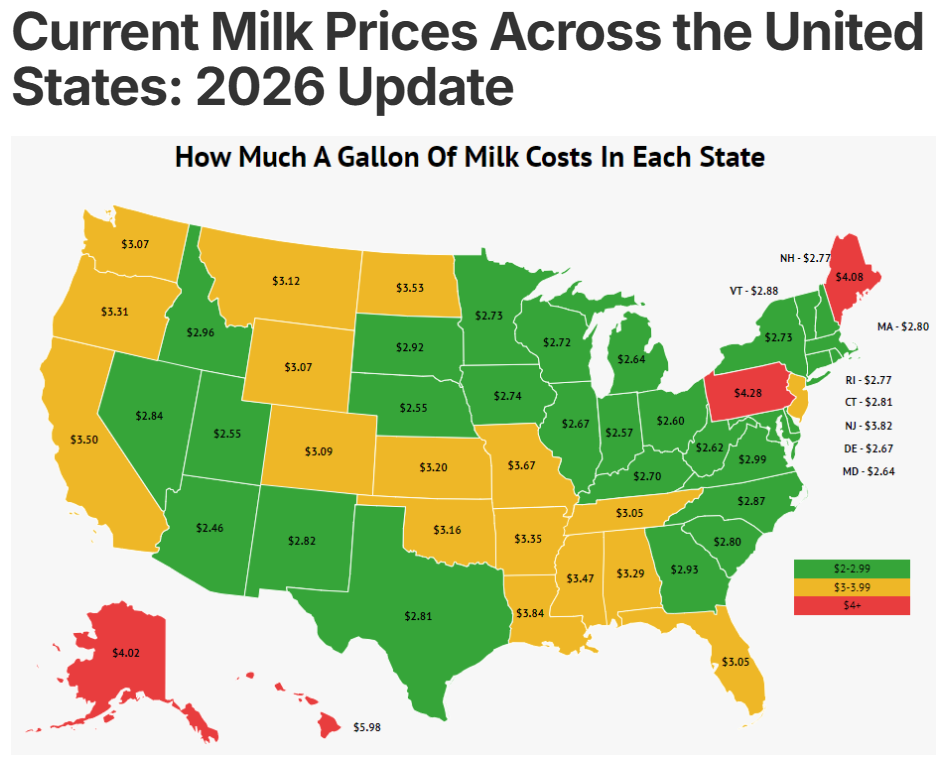
Finally, it’s important to remember that the after-tax dollars you keep are only part of the equation—your purchasing power also depends on the cost of goods and services where you live and the current inflationary index number. For example, a gallon of milk in South Dakota does not cost the same as in Alaska. On average, milk costs about $2.92 per gallon in South Dakota, compared to $4.02 in Alaska. See the map below:
If elected as your state senator, I will do my best to maintain South Dakota's high Tax Free Day ranking and fight any effort to raise your taxes. The problem in this state is not a lack of revenue—it’s a lack of discipline in how government spends it. Too often, new programs are created without accountability, and taxpayers are expected to foot the bill.
Government should live within its means, just like the families it represents. It should fund core responsibilities—not expand endlessly at your expense. When the state collects more than it needs, that money shouldn’t be quietly absorbed into more spending—it should be returned to the people or used to provide real tax relief.
Every dollar the government spends comes from you. I will work to ensure it is spent carefully, justified clearly, and never taken for granted.
Source:


Comments